Nottingham
§ This page gives an overview of the Nottingham local authority district, bringing together key facts, maps, and data to help you quickly understand the area. This is one of 361 LAD profiles on Baseview.
Overview ⁞ Nottingham is a historic city on the River Trent, famed for its links to Robin Hood and the medieval Nottingham Castle, which overlooks the city from Castle Rock. The Lace Market area reflects its industrial past, while caves beneath the city form a unique network of heritage attractions. Nottingham also has a vibrant cultural and student scene, with theatres, galleries, and sports venues. Green spaces such as Wollaton Hall and Deer Park and the Arboretum provide contrast to the bustling city centre. Its combination of legend, history, and modern vibrancy makes it one of the most distinctive cities in the Midlands.
Nottingham Boundary Map
This map shows the official boundary of the Nottingham local authority district, based on the latest geographic data published by the Office for National Statistics (ONS). It provides a clear view of the district’s extent and helps you understand how the area fits within the wider regional and national landscape.
Contains OS data © Crown copyright and database right 2025. Source: Office for National Statistics licensed under the Open Government Licence v3.0.
The administrative boundary of Nottingham can also be viewed on OpenStreetMap: District Boundary of Nottingham.
Key Facts about Nottingham
What region is Nottingham in? Nottingham is in the East Midlands of England, a region within the UK.
What county is Nottingham in? Nottingham is in the county of Nottinghamshire.
Is Nottingham a city? Yes, Nottingham is a city. Nottingham holds official city status as one of the 76 designated cities in the UK.
Who governs Nottingham? The local government for this district is: Nottingham City Council (Unitary Authority).
▶ Official website of Nottingham City Council 🔗 nottinghamcity.gov.uk
Which police force covers Nottingham? Policing in Nottingham is provided by Nottinghamshire Police 🔗 nottinghamshire.police.uk, which serves 8 local authority districts: Ashfield ⁞ Bassetlaw ⁞ Broxtowe ⁞ Gedling ⁞ Mansfield ⁞ Newark and Sherwood ⁞ Nottingham ⁞ Rushcliffe.
Nottingham in International Geographies
In the International Territorial Levels (ITLs) hierarchy, Nottingham is within one of ITLs Level 2 area, Derbyshire and Nottinghamshire, that contains the following 6 ITLs Level 3 areas:
(ITL 1) East Midlands
(ITL 2) ⇒ Derbyshire and Nottinghamshire
(ITL 3) ⇒⇒ Derby ⁞ East Derbyshire ⁞ South and West Derbyshire ⁞ Nottingham ⁞ North Nottinghamshire ⁞ South Nottinghamshire
The International Territorial Levels are used by OECD member countries for statistical purposes to classify administrative areas. We have this listable page for easy browsing of ITL names and codes: International Territorial Levels.
Constituencies in Nottingham
Nottingham is divided into 3 parliamentary constituencies, listed below in alphabetical order.
A constituency is a specific geographical area that elects one Member of Parliament (MP) to represent them in the House of Commons. The United Kingdom is divided into 650 parliamentary constituencies. We have this list page for easy browsing of all UK parliamentary constituencies: List of Constituencies.
Wards in Nottingham
Nottingham is divided into 20 wards, listed below in alphabetical order.
- Aspley
- Basford
- Berridge
- Bestwood
- Bilborough
- Bulwell
- Bulwell Forest
- Castle
- Clifton East
- Clifton West
- Dales
- Hyson Green & Arboretum
- Leen Valley
- Lenton & Wollaton East
- Mapperley
- Meadows
- Radford
- Sherwood
- St. Ann's
- Wollaton West
In the UK, a ward is a subdivision of a local authority area, used mainly for electoral and statistical purposes. Defined by the ONS, wards represent the primary unit for local elections, each returning one or more councillors to the local council. Wards are also used as a key geography for presenting population and census data. We have this list page for easy browsing of all electoral wards: List of all Electoral Wards in the UK.
Parishes in Nottingham
Nottingham is entirely unparished—there are no civil parishes in this local authority district.
Parishes are the lowest tier of local government; where they don’t exist, those very local services and representation sit directly with the principal council. We have this list page for easy browsing of all parishes: List of Civil Parishes in England and Wales.
Built-up Areas in Nottingham
Nottingham covers 10 built-up areas, listed below in alphabetical order.
- Arnold *
- Beeston (Broxtowe) *
- Bestwood Village *
- Carlton (Gedling) *
- Clifton (Nottingham) *
- Nottingham *
- Nuthall and Watnall *
- Ruddington *
- West Bridgford *
- Wilford *
In the UK, a Built-up Area (BUA) is a continuous urban area of at least 20 hectares (0.2 km²), defined by the ONS as land where buildings are generally no more than 200 metres apart, such as towns, cities, or large villages. (Note: A BUA name marked with an asterisk (*) indicates that the area is situated partly in the district of Nottingham.)
We have this list page for easy browsing of all built-up areas: List of all Built-up Areas in GB.
Railway Stations in Nottingham
Nottingham is served by a number of National Rail stations, providing rail connections to nearby towns, cities, and destinations across Great Britain. The railway stations listed below are located within the Nottingham Local Authority District and are grouped by train operating company for clarity.
- East Midlands Railway ▸ Nottingham (NG2 3AQ) ⁞ Bulwell (NG6 9AA)
This is a district-level view only. For a complete list of all National Rail stations across Great Britain, see the UK National Rail Stations Directory.
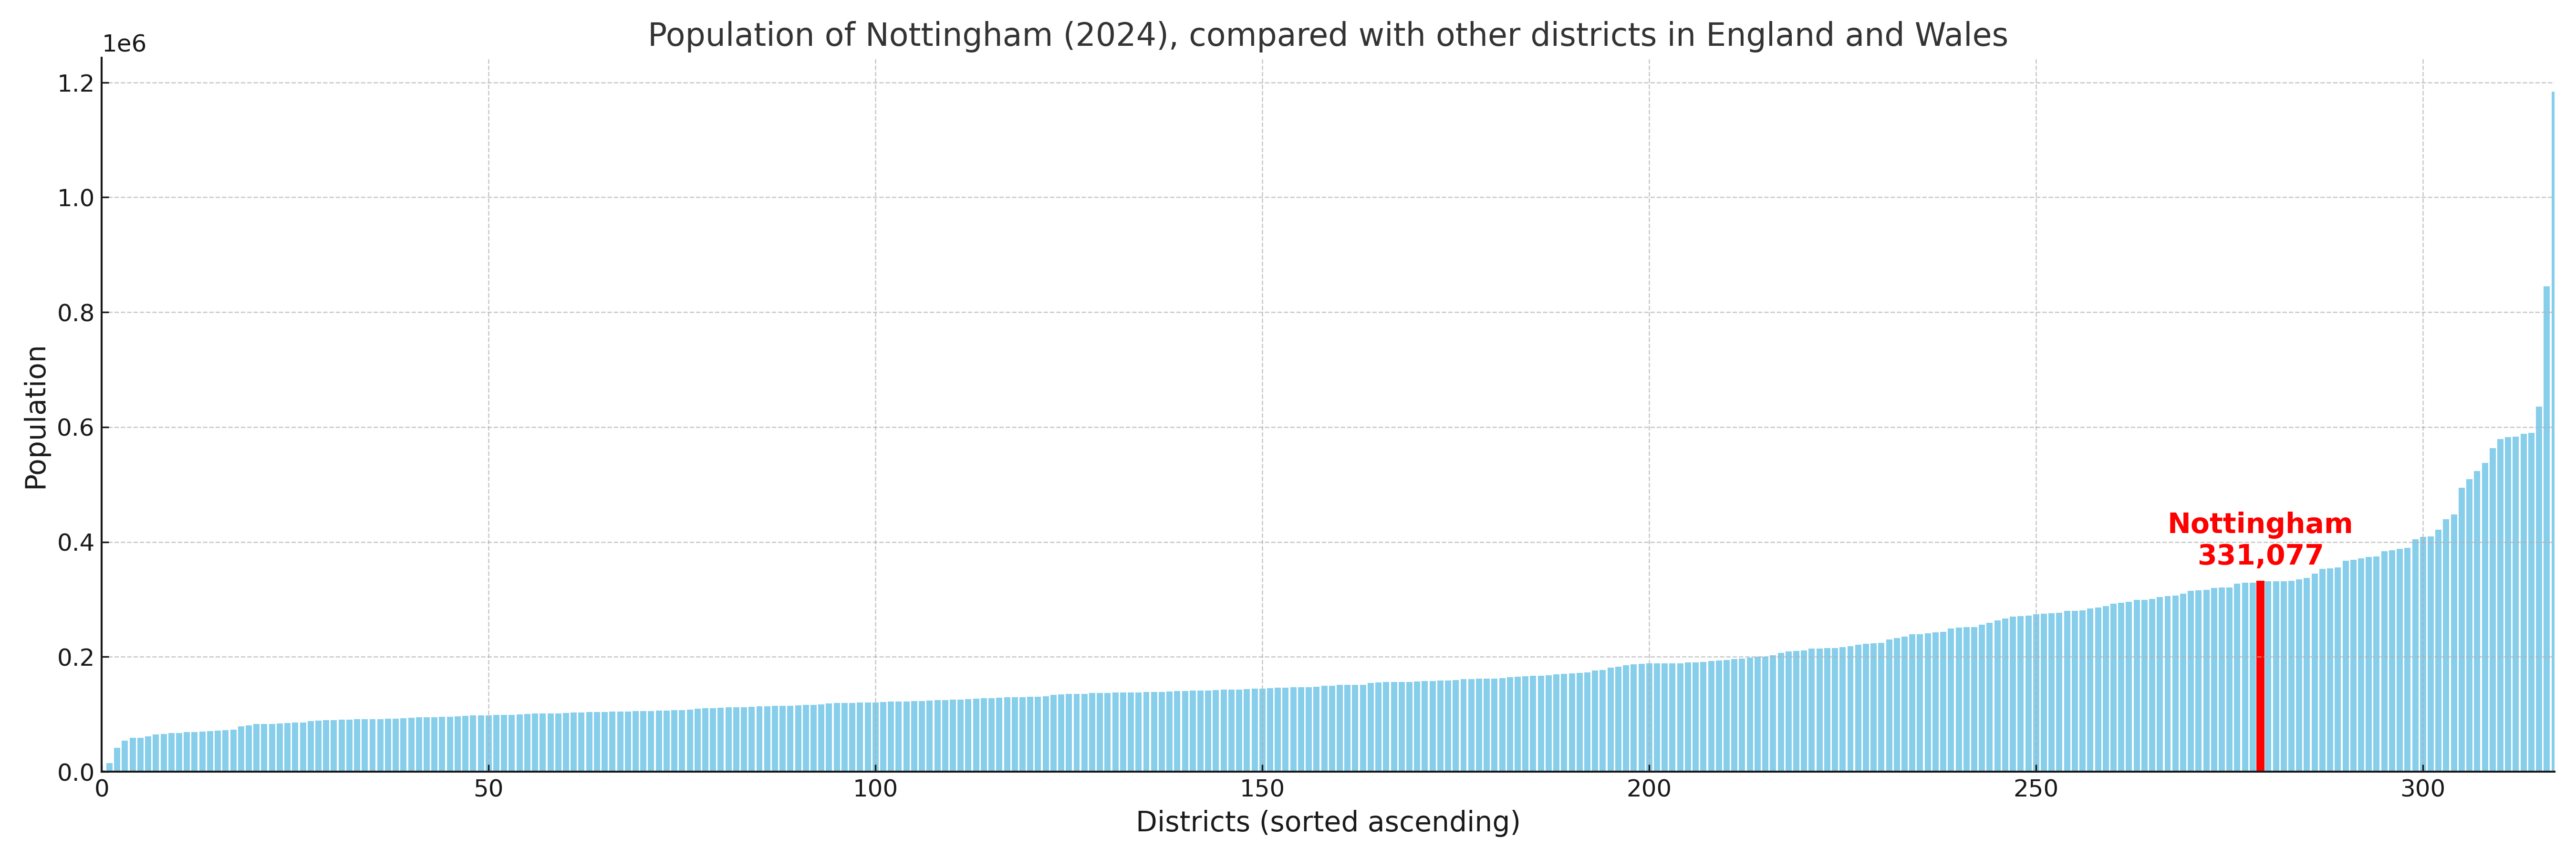
Nottingham compared with other districts in the UK
This section shows how Nottingham compares with other local authority districts in the UK, using a variety of measures and rankings.
Nottingham has 20 electoral wards.

Nottingham has a population of 331,077 (2024 mid-year estimate by ONS)
Population and Migration Trends in Nottingham
This chart shows the population trend for Nottingham from 2015 to 2024. It provides a quick overview of whether the local authority is growing, stable, or declining over time, and helps set context for the migration patterns shown below.
Population change is influenced by natural change (births minus deaths) and migration. The net migration chart below focuses on migration, separating internal migration (moves within the UK) from international migration (moves to and from abroad). Positive values indicate net inflows, while negative values indicate net outflows. The rate labels (per 1,000 residents) help compare migration intensity across years, even when the population size changes.
More local statistics and data for Nottingham can be found on the ONS statistics for Nottingham.
Latest news about Nottingham
Use the search box, or suggested search phrases, below to find recent news, council updates, planning stories, housing developments, transport changes, public services news, local elections, community issues and other local developments related to Nottingham. Results may include coverage from UK national, regional and local news websites, as well as official public-sector and local democracy sources.
- Nottingham council
- Nottingham planning
- Nottingham local elections
- Nottingham housing
- Nottingham transport
- Nottingham regeneration
- Nottingham public services