Havant
§ This page gives an overview of the Havant local authority district, bringing together key facts, maps, and data to help you quickly understand the area. This is one of 361 LAD profiles on Baseview.
Overview ⁞ Havant lies on the south Hampshire coast, bordered by Langstone and Chichester Harbours, both renowned for sailing and wildlife. Havant town provides shopping and heritage buildings, while Hayling Island is a key feature, with sandy beaches, seaside attractions, and water sports. Inland villages and countryside contrast with the coast, while nature reserves around the harbours highlight the area’s ecological importance. The district’s geography is defined by its harbours, islands, and maritime landscapes.
Havant Boundary Map
This map shows the official boundary of the Havant local authority district, based on the latest geographic data published by the Office for National Statistics (ONS). It provides a clear view of the district’s extent and helps you understand how the area fits within the wider regional and national landscape.
Contains OS data © Crown copyright and database right 2025. Source: Office for National Statistics licensed under the Open Government Licence v3.0.
The administrative boundary of Havant can also be viewed on OpenStreetMap: District Boundary of Havant.
Key Facts about Havant
What region is Havant in? Havant is in the South East of England, a region within the UK.
What county is Havant in? Havant is located in the county of Hampshire.
Is Havant a city? No, Havant is not a city. (Note: the UK has 76 officially designated cities.)
Who governs Havant? The local authority for this district is: Havant Borough Council - responsible for district-level services. Since Hampshire is a two-tier area, county-level services are handled by: Hampshire County Council.
▶ Official website of Havant Borough Council 🔗 havant.gov.uk
Which police force covers Havant? Policing in Havant is provided by Hampshire Constabulary 🔗 hampshire.police.uk, which serves 14 local authority districts: Basingstoke and Deane ⁞ East Hampshire ⁞ Eastleigh ⁞ Fareham ⁞ Gosport ⁞ Hart ⁞ Havant ⁞ Isle of Wight ⁞ New Forest ⁞ Portsmouth ⁞ Rushmoor ⁞ Southampton ⁞ Test Valley ⁞ Winchester.
Constituencies in Havant
Havant is divided into 2 parliamentary constituencies, listed below in alphabetical order.
A constituency is a specific geographical area that elects one Member of Parliament (MP) to represent them in the House of Commons. The United Kingdom is divided into 650 parliamentary constituencies. We have this list page for easy browsing of all UK parliamentary constituencies: List of Constituencies.
Wards in Havant
Havant is divided into 12 wards, listed below in alphabetical order.
- Bedhampton
- Cowplain
- Emsworth
- Hart Plain
- Havant St Faith's
- Hayling East
- Hayling West
- Leigh Park Central & West Leigh
- Leigh Park Hermitage
- Purbrook
- Stakes
- Waterloo
In the UK, a ward is a subdivision of a local authority area, used mainly for electoral and statistical purposes. Defined by the ONS, wards represent the primary unit for local elections, each returning one or more councillors to the local council. Wards are also used as a key geography for presenting population and census data. We have this list page for easy browsing of all electoral wards: List of all Electoral Wards in the UK.
Parishes in Havant
Havant is entirely unparished—there are no civil parishes in this local authority district.
Parishes are the lowest tier of local government; where they don’t exist, those very local services and representation sit directly with the principal council. We have this list page for easy browsing of all parishes: List of Civil Parishes in England and Wales.
Post Towns in Havant
Below is a list of post towns in Havant, grouped by postcode area:
- PO ▸ Havant (PO9) ⁞ Hayling Island (PO11) ⁞ Rowland's Castle (PO9) ⁞ Waterlooville (PO7 / PO8)
The UK postal hierarchy begins with broad postcode areas (such as “CB” or “M”), which are divided into smaller postcode districts (such as “CB8” or “M1”) to support accurate mail routing. Each postal address is anchored by a designated post town, the official locality name used in the UK postcode system, which operates independently from Local Authority Districts —the administrative boundaries used for council tax and local government services. Because they serve different purposes, a property’s postal address and its local authority district do not always align exactly.
Built-up Areas in Havant
Havant covers 10 built-up areas, listed below in alphabetical order.
- Emsworth *
- Havant *
- Horndean *
- North Hayling
- Portsmouth *
- Rowlands Castle *
- South Hayling
- Stoke
- Waterlooville *
- Westbourne *
In the UK, a Built-up Area (BUA) is a continuous urban area of at least 20 hectares (0.2 km²), defined by the ONS as land where buildings are generally no more than 200 metres apart, such as towns, cities, or large villages. (Note: A BUA name marked with an asterisk (*) indicates that the area is situated partly in the district of Havant.)
We have this list page for easy browsing of all built-up areas: List of all Built-up Areas in GB.
Railway Stations in Havant
Havant is served by a number of National Rail stations, providing rail connections to nearby towns, cities, and destinations across Great Britain. The railway stations listed below are located within the Havant Local Authority District and are grouped by train operating company for clarity.
- Govia Thameslink Railway (Southern) ▸ Emsworth (PO10 7PN) ⁞ Warblington (PO9 2QD)
- South Western Railway ▸ Havant (PO9 1PP) ⁞ Bedhampton (PO9 1LL)
This is a district-level view only. For a complete list of all National Rail stations across Great Britain, see the UK National Rail Stations Directory.
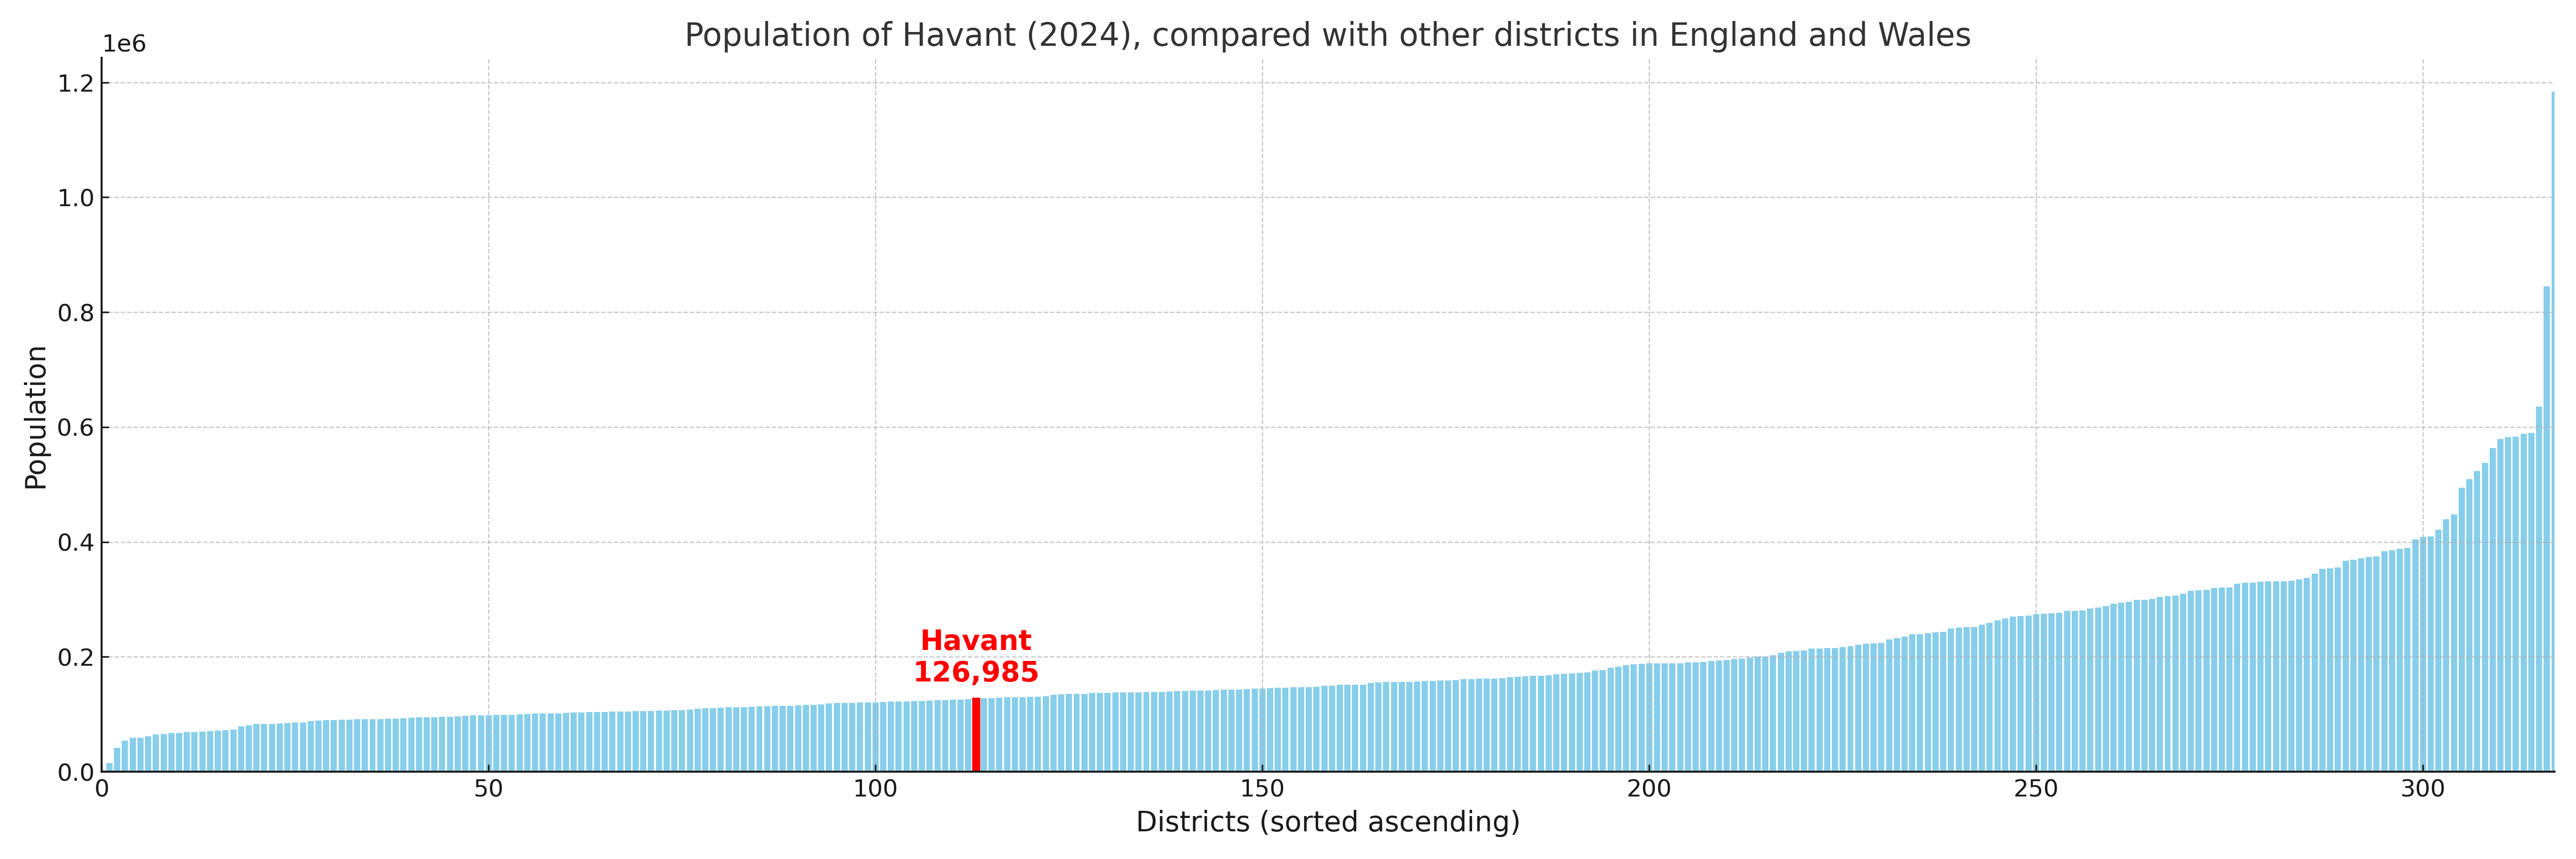
Havant compared with other districts in the UK
This section shows how Havant compares with other local authority districts in the UK, using a variety of measures and rankings.
Havant has 12 electoral wards.

Havant has a population of 126,985 (2024 mid-year estimate by ONS)
Population and Migration Trends in Havant
This chart shows the population trend for Havant from 2015 to 2024. It provides a quick overview of whether the local authority is growing, stable, or declining over time, and helps set context for the migration patterns shown below.
Population change is influenced by natural change (births minus deaths) and migration. The net migration chart below focuses on migration, separating internal migration (moves within the UK) from international migration (moves to and from abroad). Positive values indicate net inflows, while negative values indicate net outflows. The rate labels (per 1,000 residents) help compare migration intensity across years, even when the population size changes.
More local statistics and data for Havant can be found on the ONS statistics for Havant.
Latest news about Havant
Use the search box, or suggested search phrases, below to find recent news, council updates, planning stories, housing developments, transport changes, public services news, local elections, community issues and other local developments related to Havant. Results may include coverage from UK national, regional and local news websites, as well as official public-sector and local democracy sources.
- Havant council
- Havant planning
- Havant local elections
- Havant housing
- Havant transport
- Havant regeneration
- Havant public services