Bromley
§ This page gives an overview of the Bromley local authority district, bringing together key facts, maps, and data to help you quickly understand the area. This is one of 361 LAD profiles on Baseview.
Overview ⁞ Bromley is the largest London borough by area, located in the southeast and containing extensive green belt land. It has a mix of suburban neighbourhoods, rural villages, and commercial hubs, making it a commuter-friendly area with a semi-rural feel.
Bromley Boundary Map
This map shows the official boundary of the Bromley local authority district, based on the latest geographic data published by the Office for National Statistics (ONS). It provides a clear view of the district’s extent and helps you understand how the area fits within the wider regional and national landscape.
Contains OS data © Crown copyright and database right 2025. Source: Office for National Statistics licensed under the Open Government Licence v3.0.
The administrative boundary of Bromley can also be viewed on OpenStreetMap: District Boundary of Bromley.
Key Facts about Bromley
What region is Bromley in? Bromley is in the Greater London, an administrative region and a ceremonial county in England.
Is Bromley a city? No, Bromley is not a city. (Note: the UK has 76 officially designated cities.)
Who governs Bromley? The local government for this district is: The London Borough of Bromley (London Borough).
▶ Official website of The London Borough of Bromley 🔗 bromley.gov.uk
Which police force covers Bromley? Policing in Bromley is provided by Metropolitan Police Service 🔗 met.police.uk, which serves 32 London Boroughs.
Bromley in International Geographies
In the International Territorial Levels (ITLs) hierarchy, Bromley is an ITLs Level 3 area:
- (ITL 1) London
- (ITL 2) ⇒ Outer London - South
- (ITL 3) ⇒⇒ Bromley
The International Territorial Levels are used by OECD member countries for statistical purposes to classify administrative areas. We have this listable page for easy browsing of ITL names and codes: International Territorial Levels.
Constituencies in Bromley
Bromley is divided into 4 parliamentary constituencies, listed below in alphabetical order.
A constituency is a specific geographical area that elects one Member of Parliament (MP) to represent them in the House of Commons. The United Kingdom is divided into 650 parliamentary constituencies, 75 of them are in Greater London (covering 32 London boroughs). We have this list page for easy browsing of all UK parliamentary constituencies: List of Constituencies.
Wards in Bromley
Bromley is divided into 22 wards, listed below in alphabetical order.
- Beckenham Town & Copers Cope
- Bickley & Sundridge
- Biggin Hill
- Bromley Common & Holwood
- Bromley Town
- Chelsfield
- Chislehurst
- Clock House
- Crystal Palace & Anerley
- Darwin
- Farnborough & Crofton
- Hayes & Coney Hall
- Kelsey & Eden Park
- Mottingham
- Orpington
- Penge & Cator
- Petts Wood & Knoll
- Plaistow
- Shortlands & Park Langley
- St Mary Cray
- St Paul's Cray
- West Wickham
In the UK, a ward is a subdivision of a local authority area, used mainly for electoral and statistical purposes. Defined by the ONS, wards represent the primary unit for local elections, each returning one or more councillors to the local council. Wards are also used as a key geography for presenting population and census data. We have this list page for easy browsing of all electoral wards: List of all Electoral Wards in the UK.
Parishes in Bromley
Bromley is entirely unparished—there are no civil parishes in this local authority district.
Parishes are the lowest tier of local government; where they don’t exist, those very local services and representation sit directly with the principal council. We have this list page for easy browsing of all parishes: List of Civil Parishes in England and Wales.
Post Towns in Bromley
Below is a list of post towns in Bromley, grouped by postcode area:
- BR ▸ Beckenham (BR3) ⁞ Bromley (BR1 / BR2) ⁞ Chislehurst (BR7) ⁞ Keston (BR2) ⁞ Orpington (BR5 / BR6) ⁞ West Wickham (BR4)
The UK postal hierarchy begins with broad postcode areas (such as “CB” or “M”), which are divided into smaller postcode districts (such as “CB8” or “M1”) to support accurate mail routing. Each postal address is anchored by a designated post town, the official locality name used in the UK postcode system, which operates independently from Local Authority Districts —the administrative boundaries used for council tax and local government services. Because they serve different purposes, a property’s postal address and its local authority district do not always align exactly.
Built-up Areas in Bromley
Bromley covers 10 built-up areas, listed below in alphabetical order.
- Bexley *
- Bromley *
- Croydon *
- Greenwich *
- Knockholt Pound *
- Lewisham *
- Southwark *
- Swanley *
- Tatsfield *
- Well Hill *
In the UK, a Built-up Area (BUA) is a continuous urban area of at least 20 hectares (0.2 km²), defined by the ONS as land where buildings are generally no more than 200 metres apart, such as towns, cities, or large villages. (Note: A BUA name marked with an asterisk (*) indicates that the area is situated partly in the district of Bromley.)
We have this list page for easy browsing of all built-up areas: List of all Built-up Areas in GB.
Railway Stations in Bromley
Bromley is served by a number of National Rail stations, providing rail connections to nearby towns, cities, and destinations across Great Britain. The railway stations listed below are located within the Bromley Local Authority District and are grouped by train operating company for clarity.
- Govia Thameslink Railway (Southern) ▸ Birkbeck (BR3 4TA)
- Govia Thameslink Railway (Thameslink) ▸ Ravensbourne (BR3 5HE)
- London Overground ▸ Crystal Palace (SE19 2AZ) ⁞ Anerley (SE20 8PY) ⁞ Penge West (SE20 8NU)
- Southeastern ▸ Bromley South (BR1 1LX) ⁞ Orpington (BR6 0SX) ⁞ Petts Wood (BR5 1NA) ⁞ Beckenham Junction (BR3 1HY) ⁞ St Mary Cray (BR5 2PQ) ⁞ Penge East (SE20 7BQ) ⁞ Shortlands (BR2 0JA) ⁞ Clock House (BR3 4HJ) ⁞ Chislehurst (BR7 5NN) ⁞ Hayes (BR2 7EN) ⁞ Elmstead Woods (BR7 5EB) ⁞ Kent House (BR3 1JF) ⁞ Elmers End (BR3 4EJ) ⁞ West Wickham (BR4 0EH) ⁞ Bickley (BR1 2EB) ⁞ New Beckenham (BR3 1QN) ⁞ Chelsfield (BR6 6EU) ⁞ Eden Park (BR3 3DE) ⁞ Bromley North (BR1 3NN) ⁞ Sundridge Park (BR1 3TR) ⁞ Knockholt (TN14 7HR)
This is a district-level view only. For a complete list of all National Rail stations across Great Britain, see the UK National Rail Stations Directory.
Bromley compared with other districts in the UK
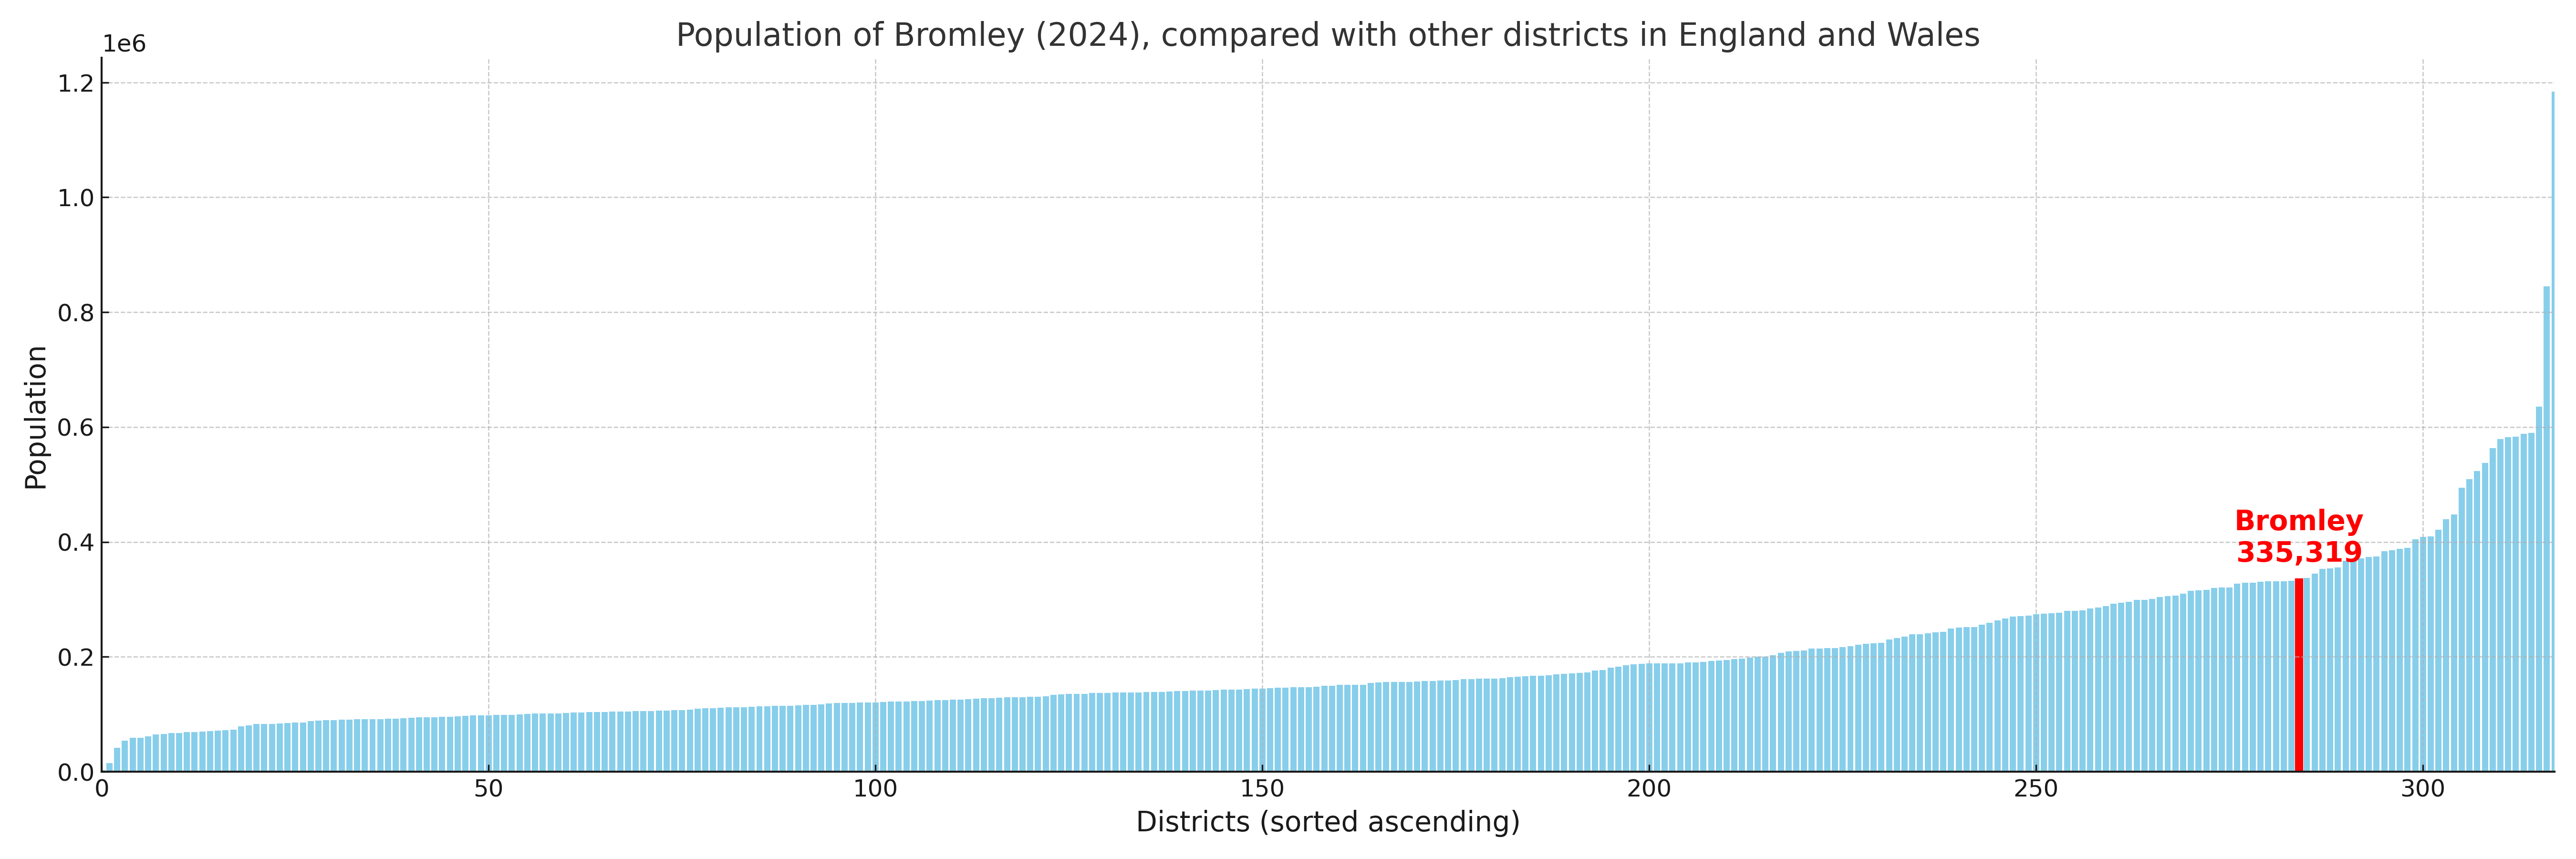
This section shows how Bromley compares with other local authority districts in the UK, using a variety of measures and rankings.
Bromley has 22 electoral wards.

Bromley has a population of 335,319 (2024 mid-year estimate by ONS)
Population and Migration Trends in Bromley
This chart shows the population trend for Bromley from 2015 to 2024. It provides a quick overview of whether the local authority is growing, stable, or declining over time, and helps set context for the migration patterns shown below.
Population change is influenced by natural change (births minus deaths) and migration. The net migration chart below focuses on migration, separating internal migration (moves within the UK) from international migration (moves to and from abroad). Positive values indicate net inflows, while negative values indicate net outflows. The rate labels (per 1,000 residents) help compare migration intensity across years, even when the population size changes.
More local statistics and data for Bromley can be found on the ONS statistics for Bromley.
Latest news about Bromley
Use the search box, or suggested search phrases, below to find recent news, council updates, planning stories, housing developments, transport changes, public services news, local elections, community issues and other local developments related to Bromley. Results may include coverage from UK national, regional and local news websites, as well as official public-sector and local democracy sources.
- Bromley council
- Bromley planning
- Bromley local elections
- Bromley housing
- Bromley transport
- Bromley regeneration
- Bromley public services