Southwark
§ This page gives an overview of the Southwark local authority district, bringing together key facts, maps, and data to help you quickly understand the area. This is one of 361 LAD profiles on Baseview.
Overview ⁞ Southwark in central and south London is rich in history and culture, home to the Shard, Borough Market, Shakespeare’s Globe, and the Tate Modern. It mixes modern development with historic districts such as Bermondsey and Rotherhithe.
Southwark Boundary Map
This map shows the official boundary of the Southwark local authority district, based on the latest geographic data published by the Office for National Statistics (ONS). It provides a clear view of the district’s extent and helps you understand how the area fits within the wider regional and national landscape.
Contains OS data © Crown copyright and database right 2025. Source: Office for National Statistics licensed under the Open Government Licence v3.0.
The administrative boundary of Southwark can also be viewed on OpenStreetMap: District Boundary of Southwark.
Key Facts about Southwark
What region is Southwark in? Southwark is in the Greater London, an administrative region and a ceremonial county in England.
Is Southwark a city? No, Southwark is not a city. (Note: the UK has 76 officially designated cities.)
Who governs Southwark? The local government for this district is: The London Borough of Southwark (London Borough).
▶ Official website of The London Borough of Southwark 🔗 southwark.gov.uk

Which police force covers Southwark? Policing in Southwark is provided by Metropolitan Police Service 🔗 met.police.uk, which serves 32 London Boroughs.
Southwark in International Geographies
In the International Territorial Levels (ITLs) hierarchy, Southwark is within an ITLs Level 3 area:
- (ITL 1) London
- (ITL 2) ⇒ Inner London - East
- (ITL 3) ⇒⇒ Lewisham and Southwark
The International Territorial Levels are used by OECD member countries for statistical purposes to classify administrative areas. We have this listable page for easy browsing of ITL names and codes: International Territorial Levels.
Constituencies in Southwark
Southwark is divided into 5 parliamentary constituencies, listed below in alphabetical order.
- Bermondsey and Old Southwark
- Dulwich and West Norwood
- Lewisham West and East Dulwich
- Peckham
- Vauxhall and Camberwell Green
A constituency is a specific geographical area that elects one Member of Parliament (MP) to represent them in the House of Commons. The United Kingdom is divided into 650 parliamentary constituencies, 75 of them are in Greater London (covering 32 London boroughs). We have this list page for easy browsing of all UK parliamentary constituencies: List of Constituencies.
Wards in Southwark
Southwark is divided into 23 wards, listed below in alphabetical order.
- Borough & Bankside
- Camberwell Green
- Champion Hill
- Chaucer
- Dulwich Hill
- Dulwich Village
- Dulwich Wood
- Faraday
- Goose Green
- London Bridge & West Bermondsey
- Newington
- North Bermondsey
- North Walworth
- Nunhead & Queen's Road
- Old Kent Road
- Peckham
- Peckham Rye
- Rotherhithe
- Rye Lane
- South Bermondsey
- St George's
- St Giles
- Surrey Docks
In the UK, a ward is a subdivision of a local authority area, used mainly for electoral and statistical purposes. Defined by the ONS, wards represent the primary unit for local elections, each returning one or more councillors to the local council. Wards are also used as a key geography for presenting population and census data. We have this list page for easy browsing of all electoral wards: List of all Electoral Wards in the UK.
Parishes in Southwark
Southwark is entirely unparished—there are no civil parishes in this local authority district.
Parishes are the lowest tier of local government; where they don’t exist, those very local services and representation sit directly with the principal council. We have this list page for easy browsing of all parishes: List of Civil Parishes in England and Wales.
Built-up Areas in Southwark
Southwark covers 5 built-up areas, listed below in alphabetical order.
- Bromley *
- City and County of the City of London *
- Lambeth *
- Lewisham *
- Southwark *
In the UK, a Built-up Area (BUA) is a continuous urban area of at least 20 hectares (0.2 km²), defined by the ONS as land where buildings are generally no more than 200 metres apart, such as towns, cities, or large villages. (Note: A BUA name marked with an asterisk (*) indicates that the area is situated partly in the district of Southwark.)
We have this list page for easy browsing of all built-up areas: List of all Built-up Areas in GB.
Railway Stations in Southwark
Southwark is served by a number of National Rail stations, providing rail connections to nearby towns, cities, and destinations across Great Britain. The railway stations listed below are located within the Southwark Local Authority District and are grouped by train operating company for clarity.
- Govia Thameslink Railway (Southern) ▸ Peckham Rye (SE15 4RX) ⁞ Queens Road Peckham (SE15 2JR) ⁞ East Dulwich (SE22 8EF) ⁞ South Bermondsey (SE16 3JB)
- Govia Thameslink Railway (Thameslink) ▸ Denmark Hill (SE5 8BB) ⁞ Elephant and Castle (SE17 1LB) ⁞ Nunhead (SE15 3XE)
- London Overground ▸ Surrey Quays (SE16 2UE) ⁞ Rotherhithe (SE16 4LF)
- London Underground ▸ Canada Water (SE16 2YS)
- Network Rail ▸ London Bridge (SE1 3QX)
- Southeastern ▸ Waterloo East (SE1 8NH) ⁞ West Dulwich (SE21 8HN) ⁞ Sydenham Hill (SE21 7ND)
This is a district-level view only. For a complete list of all National Rail stations across Great Britain, see the UK National Rail Stations Directory.
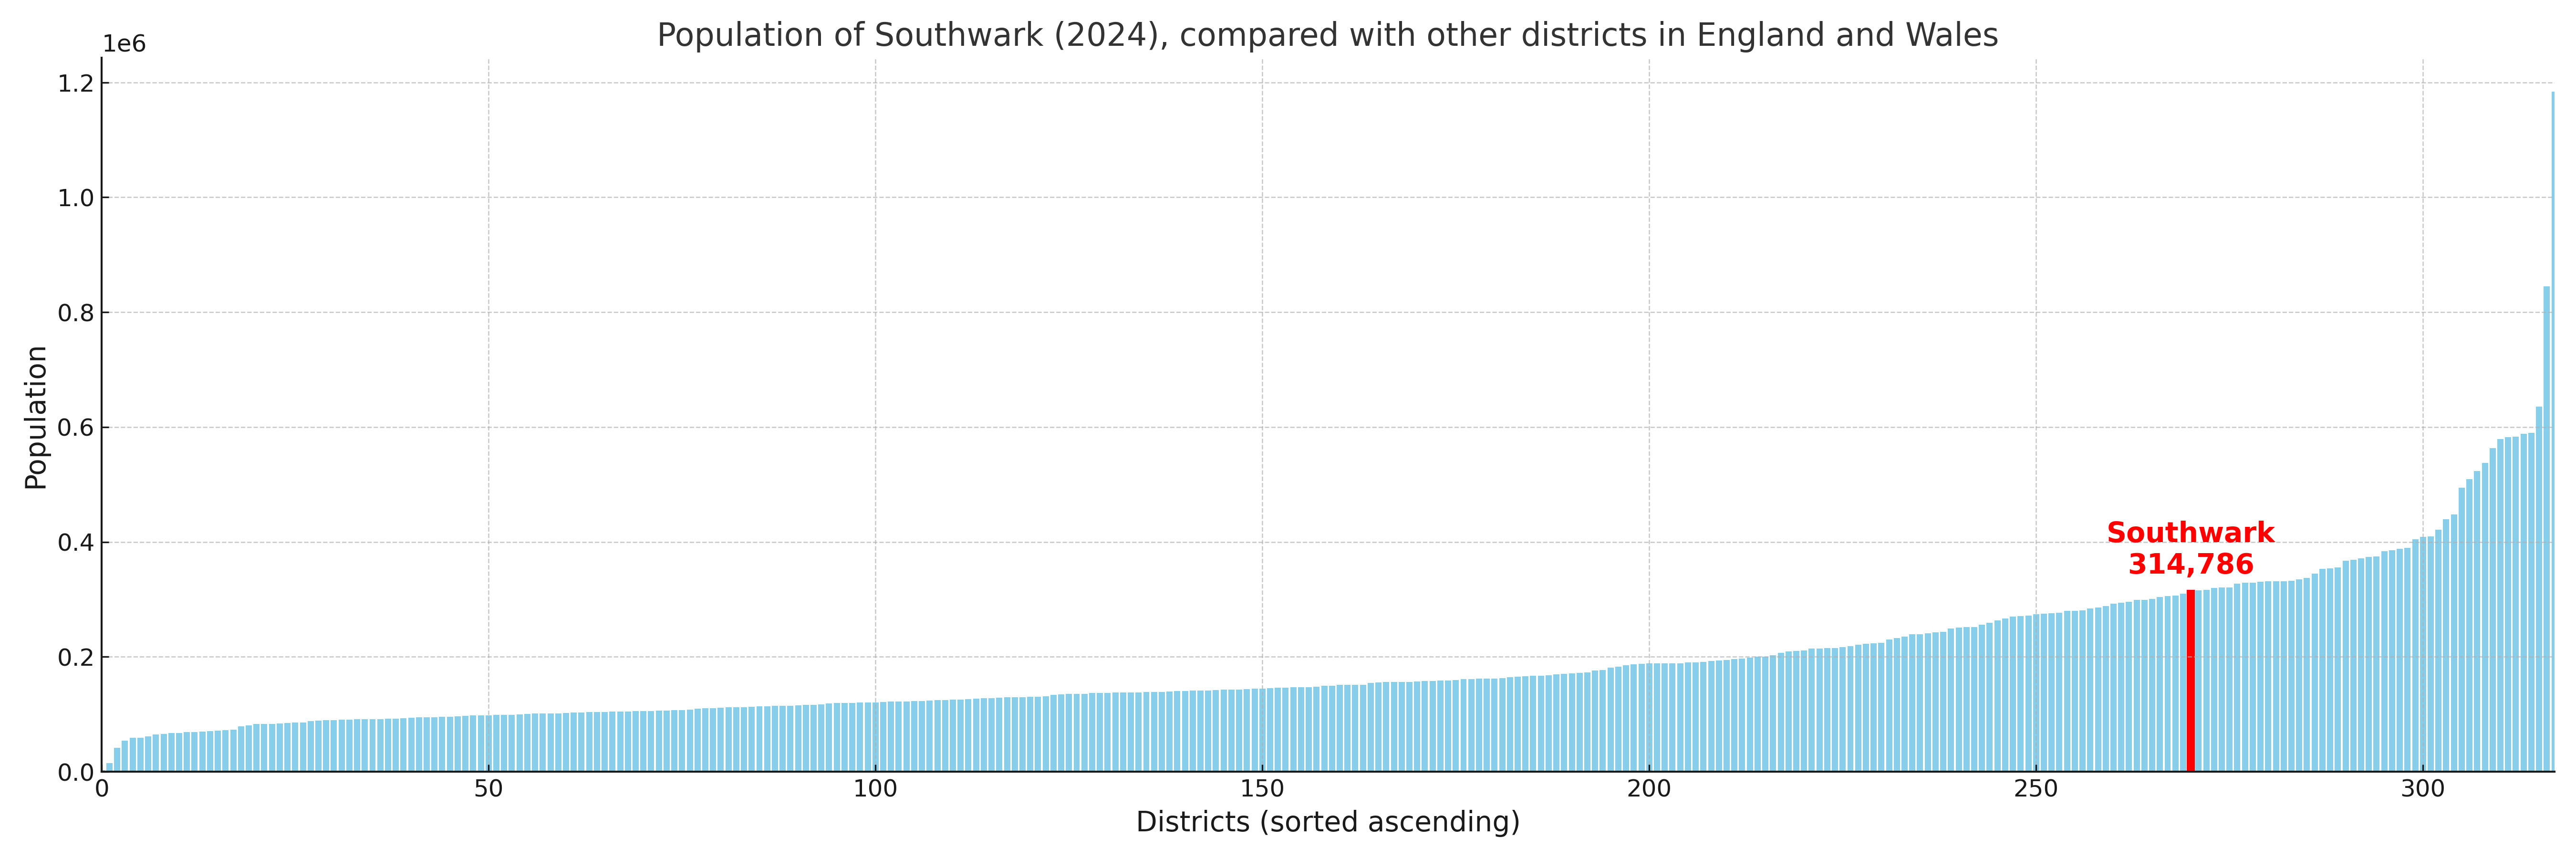
Southwark compared with other districts in the UK
This section shows how Southwark compares with other local authority districts in the UK, using a variety of measures and rankings.
Southwark has 23 electoral wards.

Southwark has a population of 314,786 (2024 mid-year estimate by ONS)
Population and Migration Trends in Southwark
This chart shows the population trend for Southwark from 2015 to 2024. It provides a quick overview of whether the local authority is growing, stable, or declining over time, and helps set context for the migration patterns shown below.
Population change is influenced by natural change (births minus deaths) and migration. The net migration chart below focuses on migration, separating internal migration (moves within the UK) from international migration (moves to and from abroad). Positive values indicate net inflows, while negative values indicate net outflows. The rate labels (per 1,000 residents) help compare migration intensity across years, even when the population size changes.
More local statistics and data for Southwark can be found on the ONS statistics for Southwark.
Latest news about Southwark
Use the search box, or suggested search phrases, below to find recent news, council updates, planning stories, housing developments, transport changes, public services news, local elections, community issues and other local developments related to Southwark. Results may include coverage from UK national, regional and local news websites, as well as official public-sector and local democracy sources.
- Southwark council
- Southwark planning
- Southwark local elections
- Southwark housing
- Southwark transport
- Southwark regeneration
- Southwark public services